Installing Grafana on My Home Server
This post continues my home server series, once again serving as notes for my future self. As I explained before, my home server is an Intel NUC mini-PC that I only access via SSH. So I wanted a way to monitor system resource usage without having to manually SSH in and open BTOP or NTOP.
I had been too lazy to install Grafana back then, but I finally got around to it, and it was much easier than I expected, which is why I decided to share how I did it.
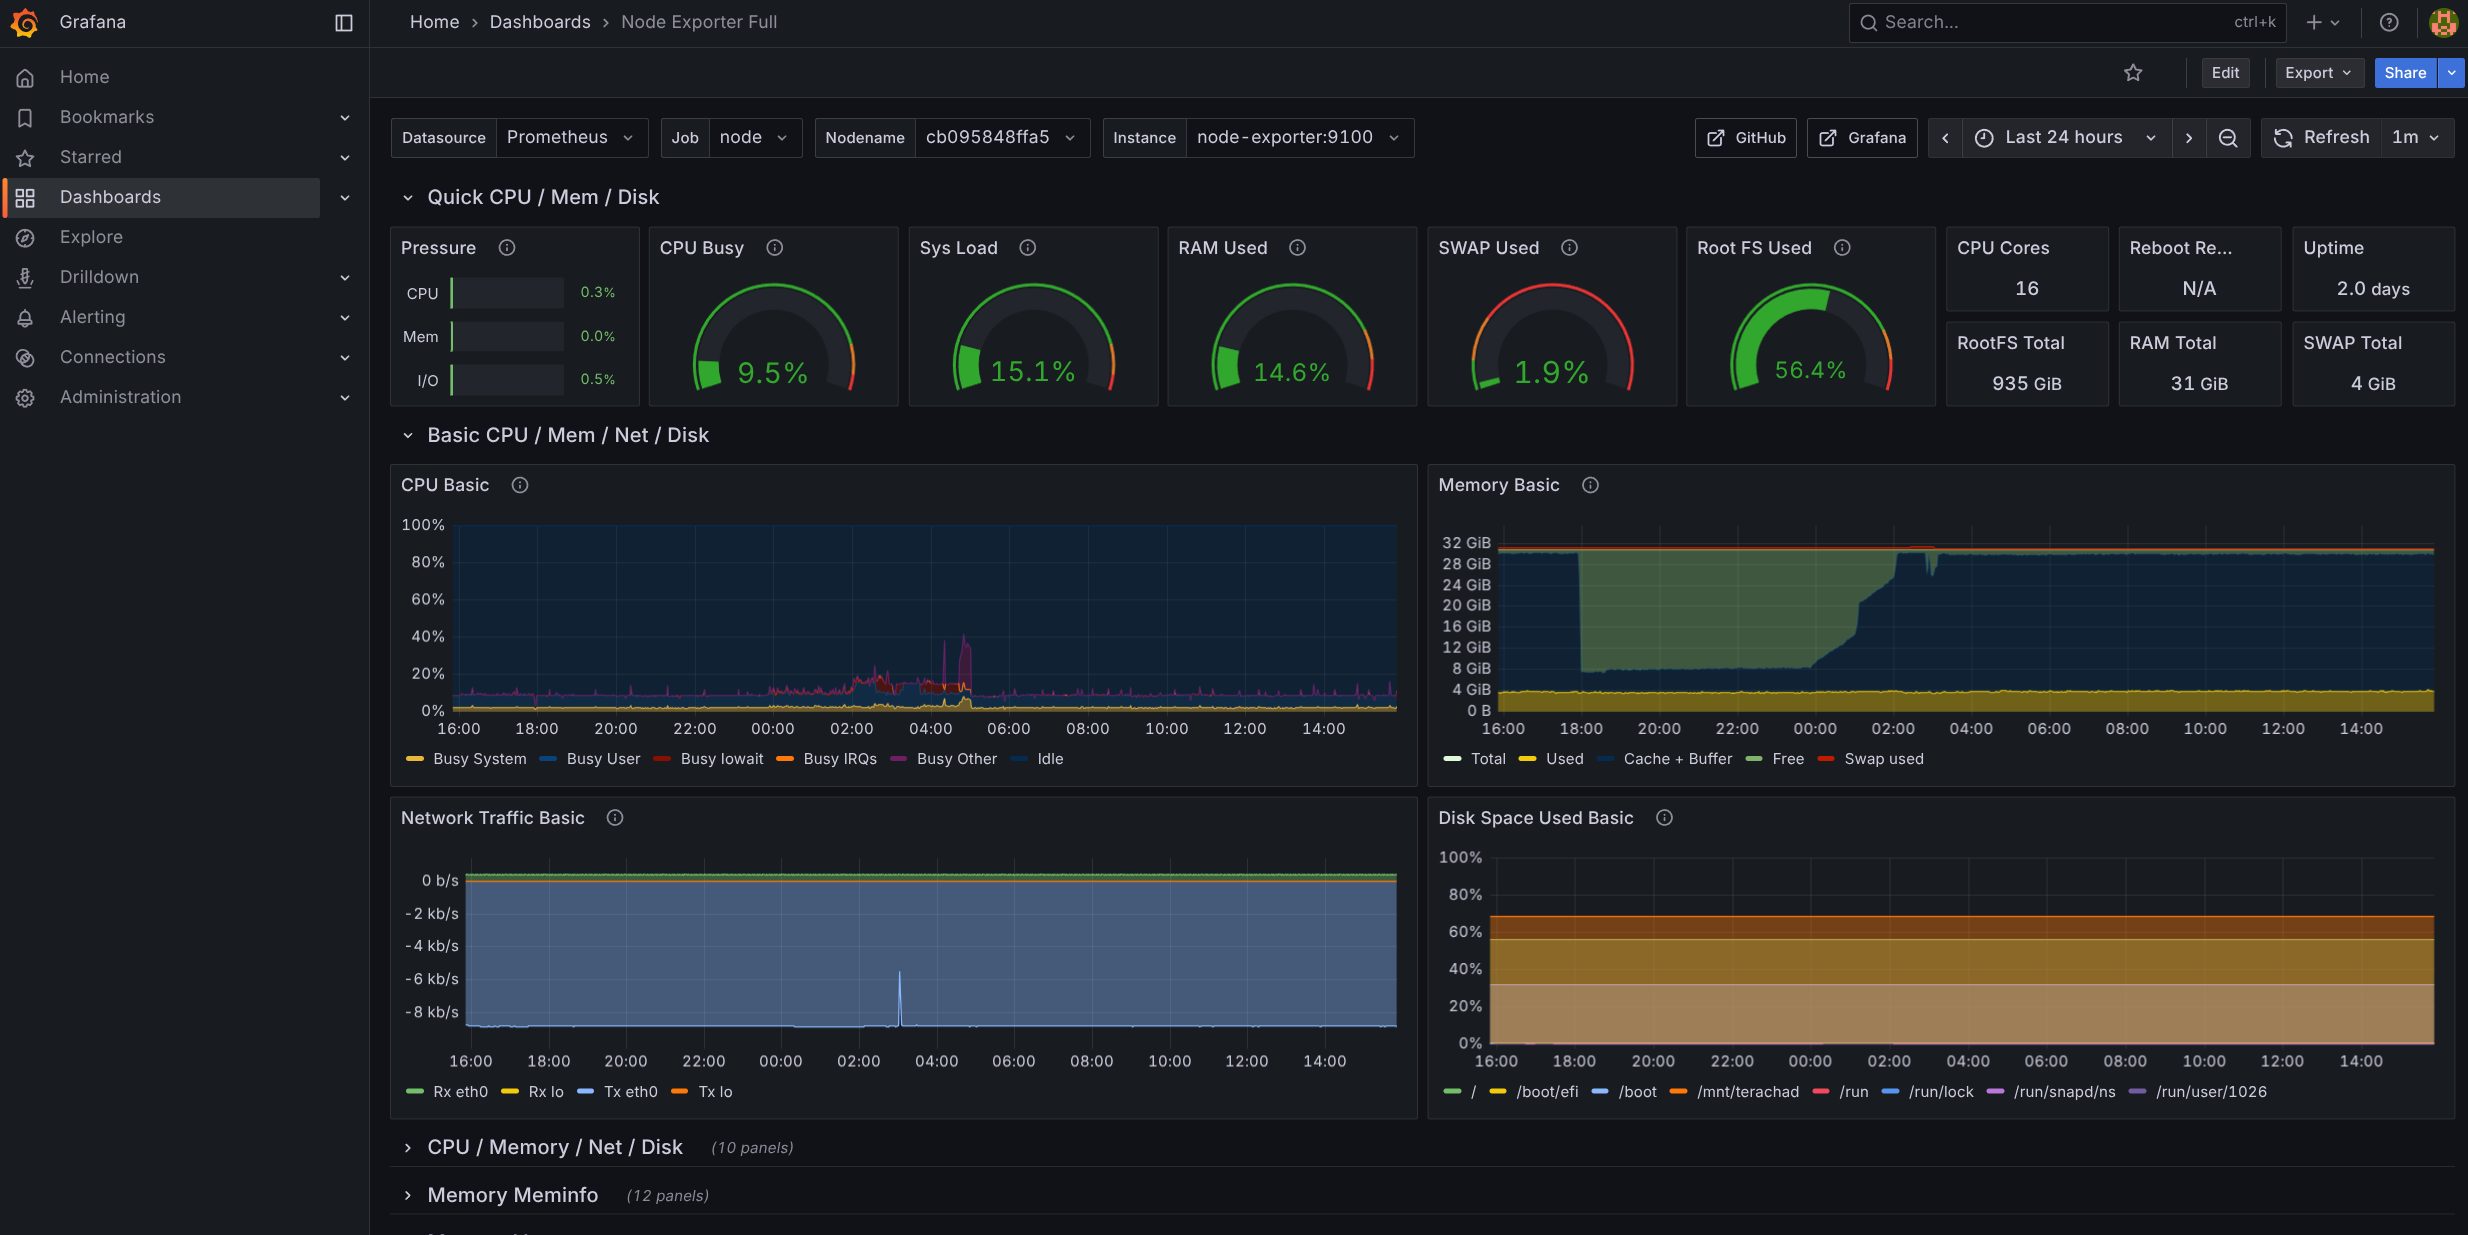
The idea is to spin up cAdvisor, which monitors container resources, and Prometheus, which scrapes system resource data, then consolidate the data from both into Grafana, a web application that lets you build graphical dashboards to monitor your systems. If you do it right, in the end you’ll have a screen like this:
Installation
Spinning this up on my home server is very simple. I do everything with Docker Compose, so:
# monitor-docker-compose.yml
networks:
  monitoring:
    driver: bridge

volumes:
  prometheus_data:
  grafana_data:

services:
  node-exporter:
    image: quay.io/prometheus/node-exporter:latest
    command:
      - --path.rootfs=/host
    pid: host
    restart: unless-stopped
    networks: [monitoring]
    volumes:
      - /:/host:ro,rslave
    security_opt: ["no-new-privileges:true"]
    read_only: true

  cadvisor:
    image: gcr.io/cadvisor/cadvisor:latest
    restart: unless-stopped
    networks: [monitoring]
    ports: ["8080:8080"]   # optional: expose UI locally
    volumes:
      - /:/rootfs:ro
      - /var/run:/var/run:ro
      - /sys:/sys:ro
      - /var/lib/docker/:/var/lib/docker:ro
      - /dev/disk/:/dev/disk:ro
    security_opt: ["no-new-privileges:true"]
    read_only: true

  prometheus:
    image: prom/prometheus:latest
    restart: unless-stopped
    networks: [monitoring]
    volumes:
      - prometheus_data:/prometheus
      - ./prometheus.yml:/etc/prometheus/prometheus.yml:ro
    command:
      - --config.file=/etc/prometheus/prometheus.yml
      - --storage.tsdb.path=/prometheus
      - --storage.tsdb.retention.time=30d
      - --web.enable-lifecycle
    ports: ["9090:9090"]
    security_opt: ["no-new-privileges:true"]
    read_only: true

  grafana:
    image: grafana/grafana:latest
    restart: unless-stopped
    networks: [monitoring]
    depends_on: [prometheus]
    ports: ["3001:3000"]
    environment:
      GF_SECURITY_ADMIN_USER: admin
      GF_SECURITY_ADMIN_PASSWORD: change-me
      GF_USERS_ALLOW_SIGN_UP: "false"
    volumes:
      - grafana_data:/var/lib/grafana
      - ./provisioning/datasources:/etc/grafana/provisioning/datasources:ro
    security_opt: ["no-new-privileges:true"]
Pay attention to the local directory mappings. If you put /etc/grafana/prometheus.yml, for example, you have to change this line:
...
    volumes:
      - prometheus_data:/prometheus
      - /etc/grafana/prometheus.yml:/etc/prometheus/prometheus.yml:ro
...
Speaking of which, here’s the prometheus.yml:
global:
  scrape_interval: 15s

scrape_configs:
  - job_name: 'prometheus'
    static_configs: [{ targets: ['prometheus:9090'] }]

  - job_name: 'node'
    static_configs: [{ targets: ['node-exporter:9100'] }]

  - job_name: 'cadvisor'
    static_configs: [{ targets: ['cadvisor:8080'] }]
And finally /etc/grafana/provisioning/datasources/datasource.yaml:
apiVersion: 1
datasources:
  - name: Prometheus
    type: prometheus
    access: proxy
    url: http://prometheus:9090
    isDefault: true
Be careful with port mappings too. The recommended approach is this:
ports: ["127.0.0.1:8080:8080"]That’s because cAdvisor and Prometheus only need to be accessible to Grafana, inside the home server, and there’s no reason to bind on 0.0.0.0 and have them reachable from outside the server. That’s your call. Since I’m on a home LAN and there are no tunnels pointing to these services, it makes no difference to me.
If, like me, you already have a service sitting on port 8080, cAdvisor will fail. In that case, remap the ports and reconfigure Prometheus, or just remove the port line. You don’t need cAdvisor exposed externally.
Another detail: by default, Grafana comes up on port 3000, but I changed it to 3001 because I already had another service on that port. So once it’s up, I can access it at http://192.168.0.200:3001.
As I explained in the Cloudflared article, I route this address through Cloudflare to get a nice domain like https://grafana.fabioakita.dev to access it both locally and remotely, if I want. Go read those other articles afterward to understand how.
And that’s it, now just spin up the containers:
docker compose -f monitor-docker-compose.yml up -dDone, super simple. I should have done this sooner.
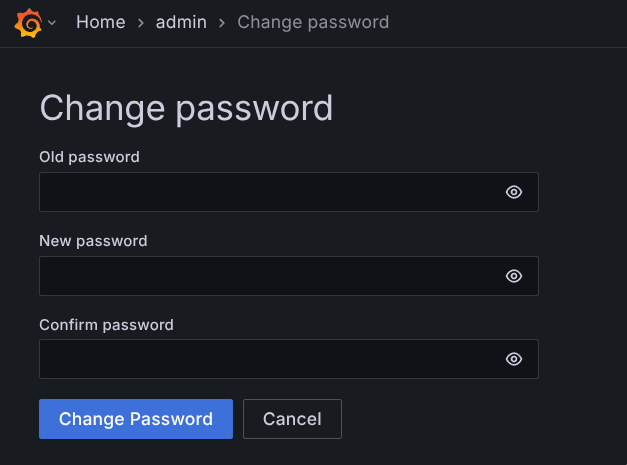
As you can see in the Docker Compose file, when you open the site for the first time, the login is admin with password change-me. Obviously, the first thing to do is change the password:
Dashboards
Now we’re practically done. We can check whether Prometheus is working and integrated. Just go to the “Connections” menu and “Data Sources”:
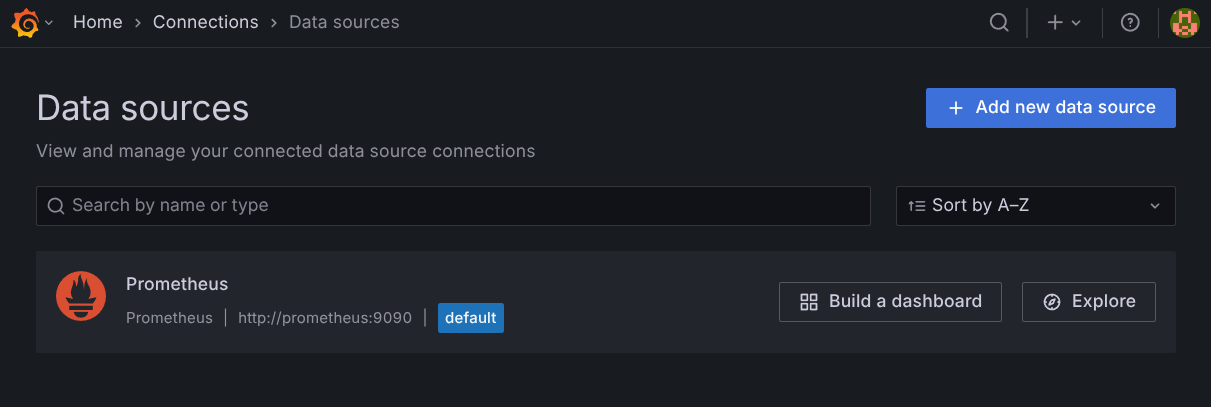
Grafana can consolidate data from dozens of different sources, and Prometheus is only one of them. In a larger, more complex infrastructure, this list would be huge.
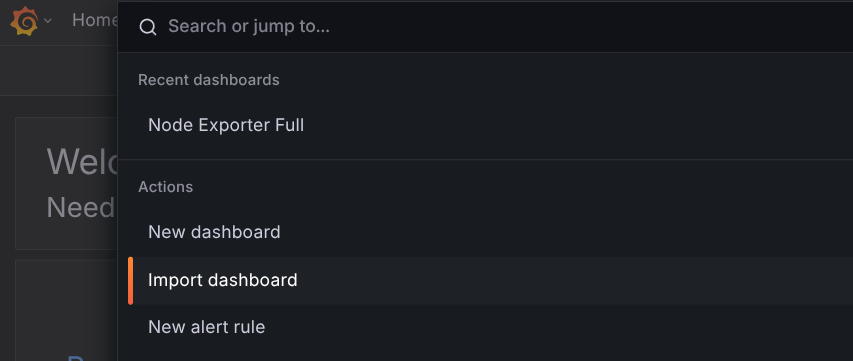
To build dashboards, you can start from scratch and assemble them widget by widget, but it’s easier to import dashboards that already exist. Just click the magnifying glass at the top, in the search box, and choose “Import dashboards”:
On that page you can either import a JSON file, copy and paste the JSON, or search by an ID already registered on grafana.com:
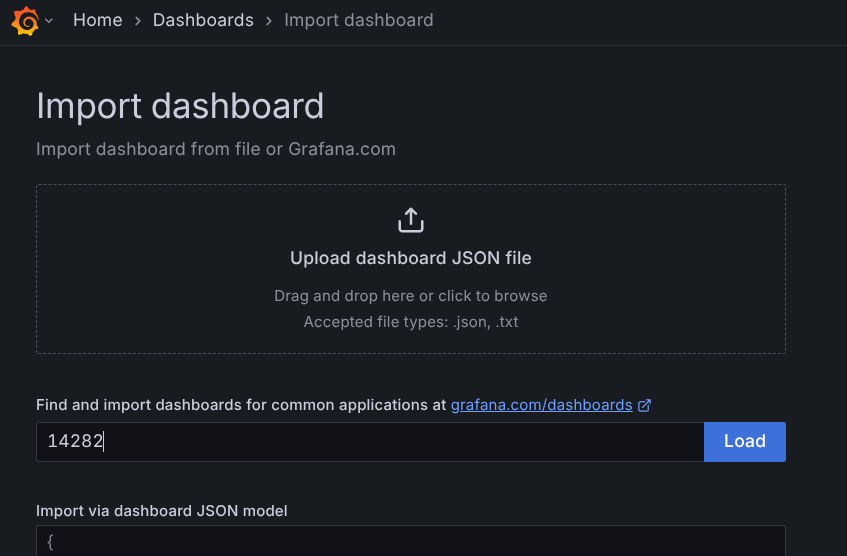
Right off the bat, I learned that there are 3 IDs that are useful for me:
- 1860 - Node Exporter Full - the screenshot at the beginning of this article, with several system metrics like CPU, memory, disk, network, etc. The most useful one for me.
- 13484 - Docker/cAdvisor Exporter - CPU and memory metrics, but broken down per container running on the server.
- 3662 - Prometheus 2.0 overview - a general health summary.
If you like these or other dashboards, just favorite them with a “pin” and you’re set.
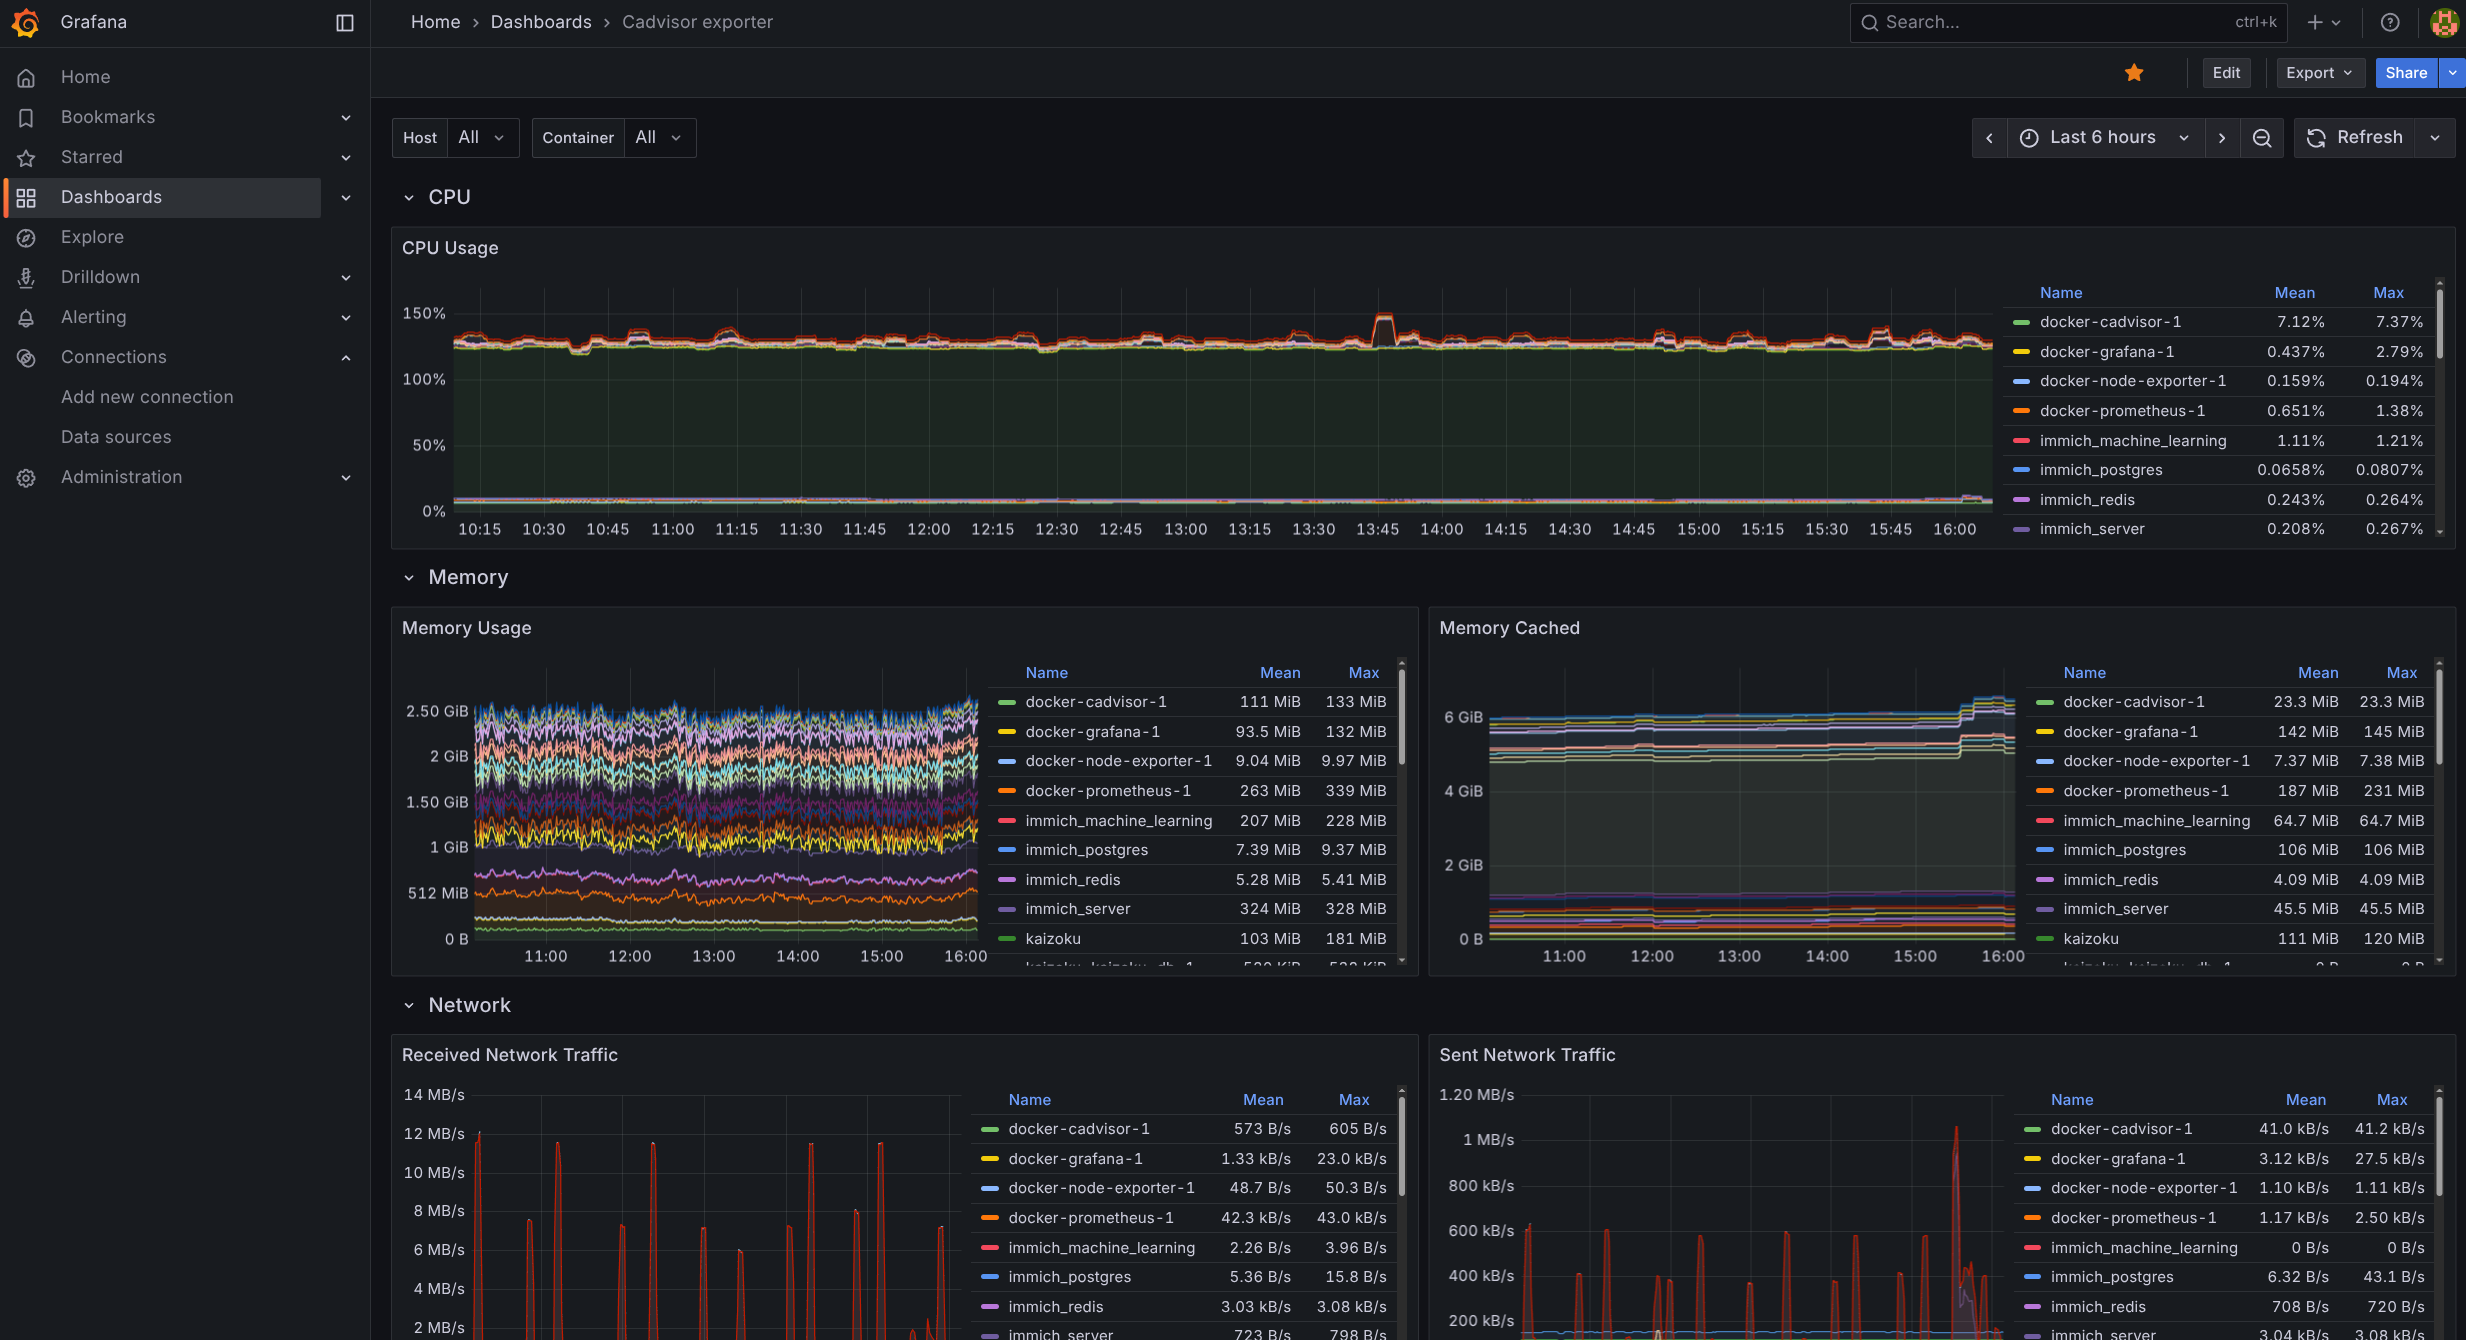
For example, here’s the cAdvisor dashboard:
I haven’t explored other dashboards yet. If you have ID recommendations to import, drop them in the comments below!
With this, I have a quick and good-looking view of my home server’s resource usage, and I can spot anything weird happening right away. These services don’t seem to consume many resources, so I can leave them running alongside the other containers.